

 97 Percent of LTC Insurance Claimants are Satisfied, According to a 2016 Report
Claimant Satisfaction
Claimant Satisfaction
Expenditures on long term care in the United States now exceed $225B each year. While the lion's share is paid by Medicaid (>60%), no small number of private policyholders exist (7.2M) who may one day turn to one of dozens of insurance companies for reimbursement. In fact, about 250,000 such policyholders are on claim at any given time, with a new 70,000 joining the rolls each year. Once we subtract those whose claims terminate each year (eg. due to recovery, exhaustion or death), the net effect is a ~12% annual growth rate in incurred claims over the last decade-and-a-half.
With so many counting on us, and so many more yet to come (an estimated $800B will be paid out over our policyholders' lifetimes), it's worth performing an audit to ensure we are delivering on our promises.
To find out, AHIP commissioned a survey by LifePlans, led by respected researcher Dr. Marc Cohen. Each of 11 participating carriers was asked to submit a random sample of open claims, which were ultimately culled to ~1,300 completed telephone surveys of 15 – 20 minutes each. Over the course of 37 questions, the research team probed claimants’ experience with the filing process, quality of care and overall levels of satisfaction.
The full report can be found here. To help disseminate these valuable findings to as wide an audience as possible, we draw your attention below to selected excerpts.
(The claimants surveyed by LifePlans between 2015 - 2016 are consistently represented in the charts below in blue. Occasionally they are compared to an earlier cohort always charted in red. The "red group" was surveyed in 2005 by the Dept of Health and Human Services and was significant for having just initiated their claims. All slides and data are credited to Marc A. Cohen, PhD, to whom we are grateful.)
Demographics of Claimants
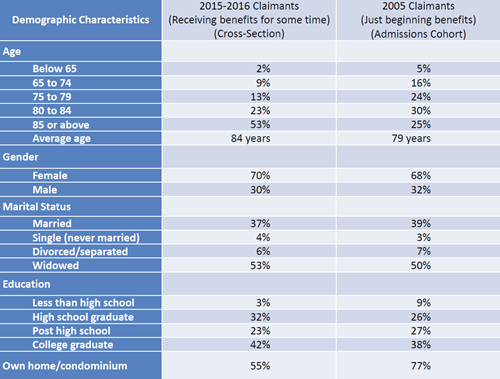
There are many places one can begin diving into the data. Let's start with a profile of our typical claimant. She is more likely female, and a well-educated widow in her 80's at that.
Comparing today's survey respondents with the cohort from a decade ago, not much has changed, with two noticeable differences: the average age has jumped, and home ownership has declined. Both of these are probably best explained by the nature of the two surveys more than anything else: a cross-sectional study is more likely to sample long-stayers.
As it turns out, claimants in the new study have been receiving benefits for an average of 2-years, with the average value of total claims paid at the time the carriers pulled their data at $118,986 per person (and separately $134,731 for those in nursing facilities, $98,589 for those in assisted living, and $76,784 for those receiving home health care). These numbers come with a big caveat, since the claims are still open.
Disability Status of Claimants
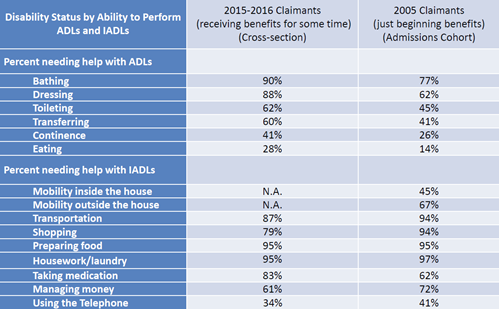
Any number of conclusions can be drawn from this data. For instance, we are reminded of the order in which activities of daily living ("ADL's") tend to fail. For those who question whether "2 of 6 ADL's" is too high a threshold to meet to qualify for benefits (as established by Congress twenty years ago), we are told today's claimants are unable to perform 3.7 ADL's on average.
Finally, while not a trigger in qualified plans, the rampant inability to perform Instrumental Activities of Daily Living ("IADL's") signals a high need for Personal Care. In particular, the need for medication management has shot up over the last decade. This trend mirrors the dangerous rise in "polypharmacy."
Distribution by Care Setting
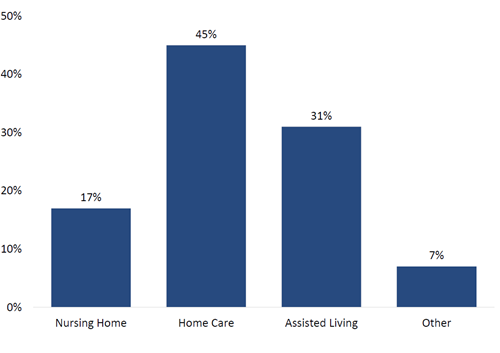
Readily apparent is the fact that over 3/4ths of claims (76%) are received in the home and community, outside an institutional setting. As we've been preaching for years, what was once dubbed "nursing home insurance" is more aptly labeled "nursing home avoidance insurance."
Meanwhile, those who choose what I've dubbed "The Medicaid Insurance Company" face a program historically known for nursing home bias. To be fair, it has spent the last decade working hard on "re-balancing," to the point that 2013 marks the first time Medicaid spent a majority (51%) of its LTC expenditures on home and community-based care-- spending nearly $57B to provide HHC to 3M. What is not widely reported are the 640,000 on waiting lists across 35 states.
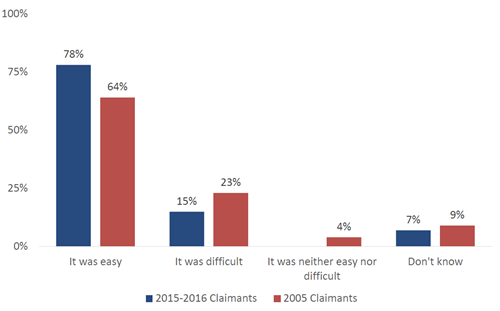
Perception of Claim Filing Process
Nearly 8 in 10 long-term care claimants reported the claim filing process was easy. It's true, some had disagreements (6%). But most of these were resolved to their satisfaction. The upshot is that, for every 100 claimants, only 2 had a disagreement they did not feel was resolved to their satisfaction.
Is this the narrative the public is taught by such publications as PBS, which sought to blow the lid off the insurance industry by exposing how LTC policies will "only pay money if [one] qualifies to receive it," or the New York Times, which compiled "some of the most common reasons that claims are denied... and discusses the difficulty that some people have encountered when trying to file a long-term care insurance claim"?
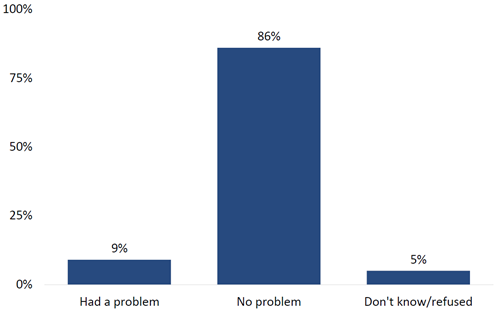
Knowledge of LTC Policy Coverage
The complexity of long-term care coverage is legendary. It's also a myth. Nearly 9 in 10 claimants (86%) had no trouble understanding what their policies cover. Those who had questions often turned to their agent or the home office for clarification.
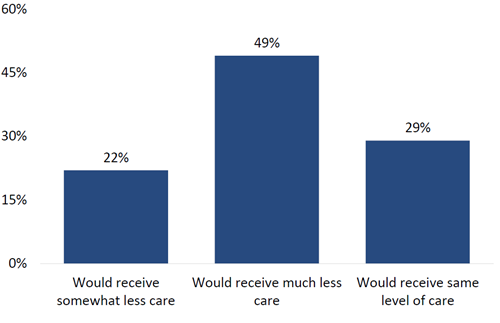
Without Insurance, How Much Care Would You Receive?
To gauge the value of insurance, one can envision life without it. This thought experiment yields striking results. In the absence of their LTC benefits, 7 in 10 claimants (71%) said they'd receive less care, half (49%) saying "much less."
In other words, these policies don't just provide surplus funds-- they provide necessary support for accessing paid care. (The data are unclear whether claimants' needs would go totally unmet, since family and friends tend to step in to fill gaps. But the point is to not burden one's loved ones.)
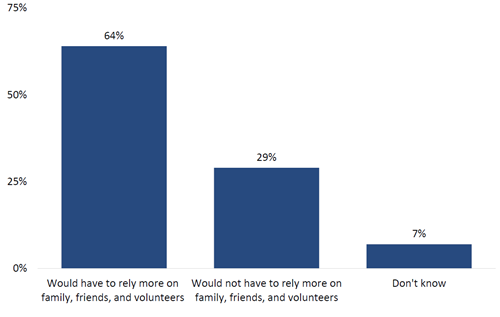
Without Insurance, Would You Need More Informal Care?
We know that one of the primary motivators behind the purchase of LTC insurance is the desire to avoid burdening family. When claimants were asked if they'd have to rely upon family, friends and volunteers in the absence of insurance, over 6 in 10 (64%) said they would.
What's interesting about caregiving is that paid services don't necessarily replace family on an hour-for-hour basis. Rather, the nature of informal care changes in the presence of formal care, emphasizing "companionship," even as family's time commitment drops only minimally (~10%). This has long been a selling point of LTC insurance: families are happier overseeing care than directly providing it.
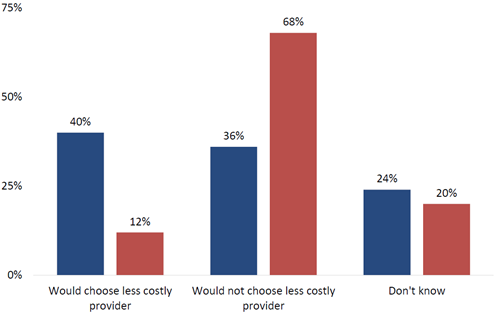
Without Insurance, Would You Economize?
At first glance, it would appear insurance doesn't have much impact on a claimant's decision to choose more affordable care. But there is a dramatic effect illustrated here: over 3 times as many claimants in the mid-stages of their claims report they would choose a less expensive provider versus those just starting out.
The newcomers have the luxury of ignorance, ie they can't see what's coming. On the other hand, those who've been on claim for several years may be keeping a keen and anxious watch over their assets and their benefit periods.
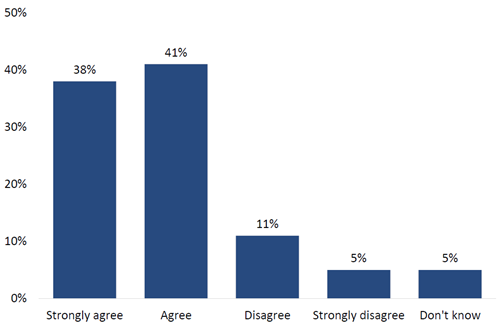
Insurance Enables Me to Receive Higher Quality Care
Although "higher quality care" may be subjective, researchers report that cost is generally understood to stand in as a proxy for quality. Whether insurance allows one to afford more expensive care, or care of higher quality, 8 in 10 claimants share this belief (79%).
When asked if insurance allows them to receive care in the setting of their choice, as before, over 3 times as many of the ongoing claimants shared this conviction compared to claimants who'd only just begun.
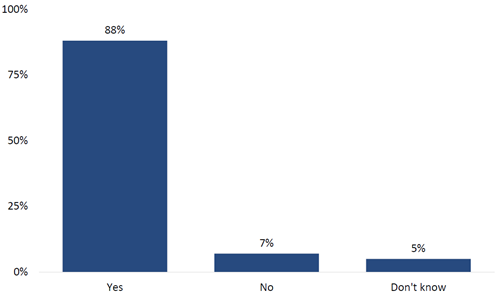
Satisfaction with Amount of Coverage
Our policyholders buy coverage many years in advance, often decades. So it can be difficult to know whether we are recommending the appropriate amount they'll need. The news is reassuring: nearly 9 in 10 are satisfied with the amount they bought (88%). Of those who are not, they wished they'd bought more, just as you'd expect.
The average claimant from the current survey holds a comprehensive policy with an elimination period of 78 days, a nursing home benefit of $123/day for 5.7 years and a home care benefit of $121/day for 5.4 years (nearly one-third have lifetime benefits). A surprisingly large number lack inflation protection (41%). Our representative claimant (avg age 84) is paying just $3,216/year, a value which incorporates whatever rate increases may have been implemented since issue.
Remember, any value which attempts to hold steady while the world around us inflates will inevitably be perceived as an anachronism, the same as we now view a $4.00 movie ticket.
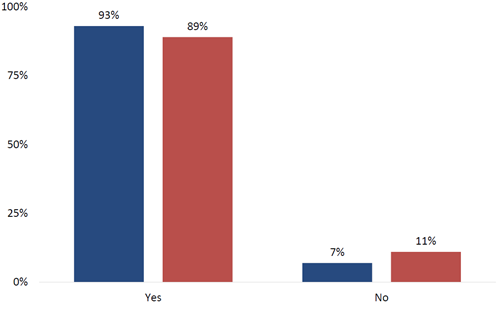
Benefits Meeting Needs
The numbers are overwhelming: 9 in 10 claimants (93%) report the benefits paid from their LTC insurance policies are adequate to their needs.
A bit of nuance: this question concerns not just the amount of coverage, but the flexibility of contract language itself. A policy that provides access to $1M, but only if spent on speech therapy delivered between 2am - 3am on alternate Wednesdays wouldn't be very useful would it! As it turns out, most LTC insurance claimants (89%) report all the services they need are paid under the terms of their coverage.
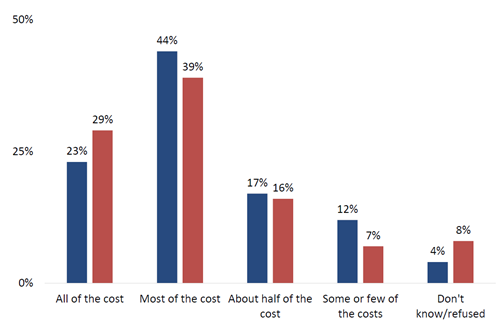
Costs Covered
One of the fundamental questions surrounding insurance--all insurance, not just long-term care-- concerns the magnitude of its role. Some buy with the intent their coverage will make them completely whole; others are comfortable ponying up co-pays and co-insurance.
While there is no "one size fits all" approach when it comes to long-term care insurance design, we can always ask the claimants themselves. About 2/3rds (67%) report their policies cover all or most of the cost of care. From a producer perspective it's important to ask, "Does this match their expectation when they first bought the policy many years ago?"
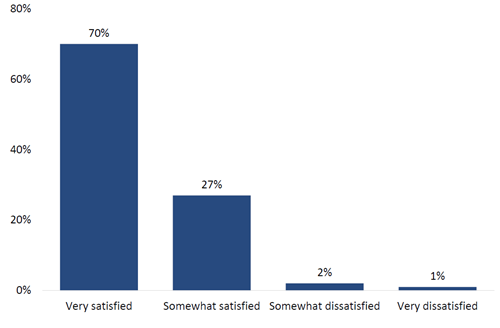
Policy Satisfaction
97 out of 100 claimants are satisfied with their long-term care insurance policies. This is great news. Most policyholder satisfaction surveys commissioned by the individual carriers have traditionally reported similarly high numbers-- but these are claimants.
Satisfaction with one's policy is highly correlated with the claim filing process itself. Those who found the process very easy were 17 times (!) more likely to report a high level of policy satisfaction (all else held equal). Similarly, those who were very satisfied with their caregiver were nearly 3 times more likely to be very satisfied. Finally, those who believed that, without insurance, they'd have to rely on family for care, were almost twice as likely (1.7x) to report a high level of policy satisfaction.
Looking at these three variables associated with claimant satisfaction, the first (ease of filing) is within the insurance company's ability to influence-- and arguably the others are to a lesser extent as well. We can either accept this survey result as prescriptive (ie this is where the industry should focus) or as congratulatory (ie at 97% satisfaction, the industry must be doing something right).
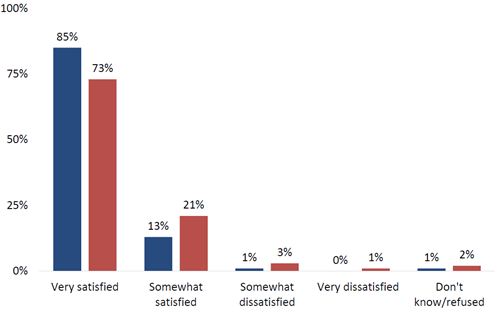
Satisfaction with Current Formal Caregiver
Finding a suitable caregiver is tricky business in which many things have to go right, from availability to capability to compatibility, and more. Above, we see how satisfaction rates rise over time. This makes sense, since it can be an unwelcome shock making that first transition from informal to paid services. Furthermore, one doesn't always land on the "right" caregiver on the first attempt-- it can take a few tries.
In spite of all this, satisfaction rates are high, with 98% either very or somewhat satisfied with their paid caregiver. When asked, recipients said they felt safe with their care provider (96%), understood them (82%), found them reliable (89%), and rated their care as high-quality (88%).
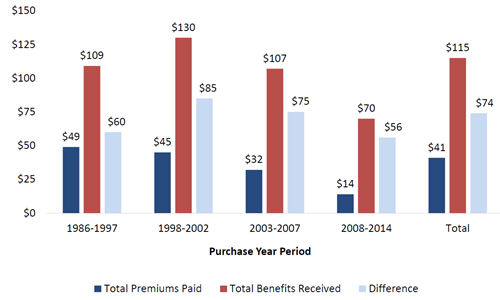
Relationship Between Premiums & Benefits
Insurance is not an investment. Some otherwise intelligent people treat it as if it were. It is a protection product in which risk is transferred. Still, there are ways to evaluate the numbers, and given the sizeable financial commitment involved, some shoppers and agents alike appreciate a math-centric approach.
The chart above takes a very straightforward look at the extent to which benefits received exceed premiums paid (from purchase date to claim date). Since claim payments from this study are a snapshot in time of open claims (for an average of 2-years), they will only rise over time.
No matter how much a policyholder is paying, or when they bought, it never takes more than a couple of months to return the entire amount paid. On average, for every $1.00 paid in premiums, claimants receive back $2.78 in benefits.
These findings are in line with earlier research from LifePlans, "The Benefits of Long-Term Care Insurance and What They Mean for Long-Term Care Financing," which was published in November, 2014 to widespread acclaim within the industry, and to the sound of one hand clapping among the mainstream press. In that work, the researchers demonstrated how 22-years of premium payments would quickly be returned after just 5-months on claim, or as long as ~7-months in the event of a 50% rate increase. Producers also read how a "self-insurer" (an oxymoronic term) would have to save and invest nearly 900% of his LTC premium each month for over 260-months to generate the same leverage as the first hour of a policy.
Two Hands Clapping
How will this new research be received? After having been previewed at last year's ILTCI Conference, then presented to the national LTC Discussion Group, and praised by the Center for Long-Term Care Reform, it's off to a promising start.
It would be a service to their readers if the national press covered these findings. But as psychologists remind us, the media have an anti-good news bias. It's very hard to get press for any positive news, be it rate stability research from the Society of Actuaries or a story on the lack of arsons overnight. Meanwhile, bad news (precisely because it's rare and shocking) steals the headlines, whether a shark bite at the beach, or an ominous model from the Center for Retirement Research.
There's been no shortage of studies released over the last twenty-four months, almost all of them drill sergeants professing to build up long-term care insurance by first tearing it down. But while we have this moment to ourselves, to celebrate what we do right and what we do well, let's acknowledge that nothing is academic for the seven million long-term care policyholders we serve.